


*Note April 2020 – this app didn’t survive the urbanstreams.net server migration well, and needs some work to get it back going again. If you are interested in using it, please contact me here, and I will move it up my list of things to do!
The tool that predicts macroinvertebrate assemblage composition for stream reaches across the Melbourne Water region has been debugged, and now includes a more flexible interface for selecting stream reaches of interest. Some further refinements to come, but please try it out if you are interested in finding out what the state of Melbourne’s streams are, and how their condition (as indicated by the macroinvertebrates that live in them) could change as a result of future changes in land use, in management approaches (to urban stormwater runoff or vegetation management), and in climate.
Here are some screenshots that take you through the process.
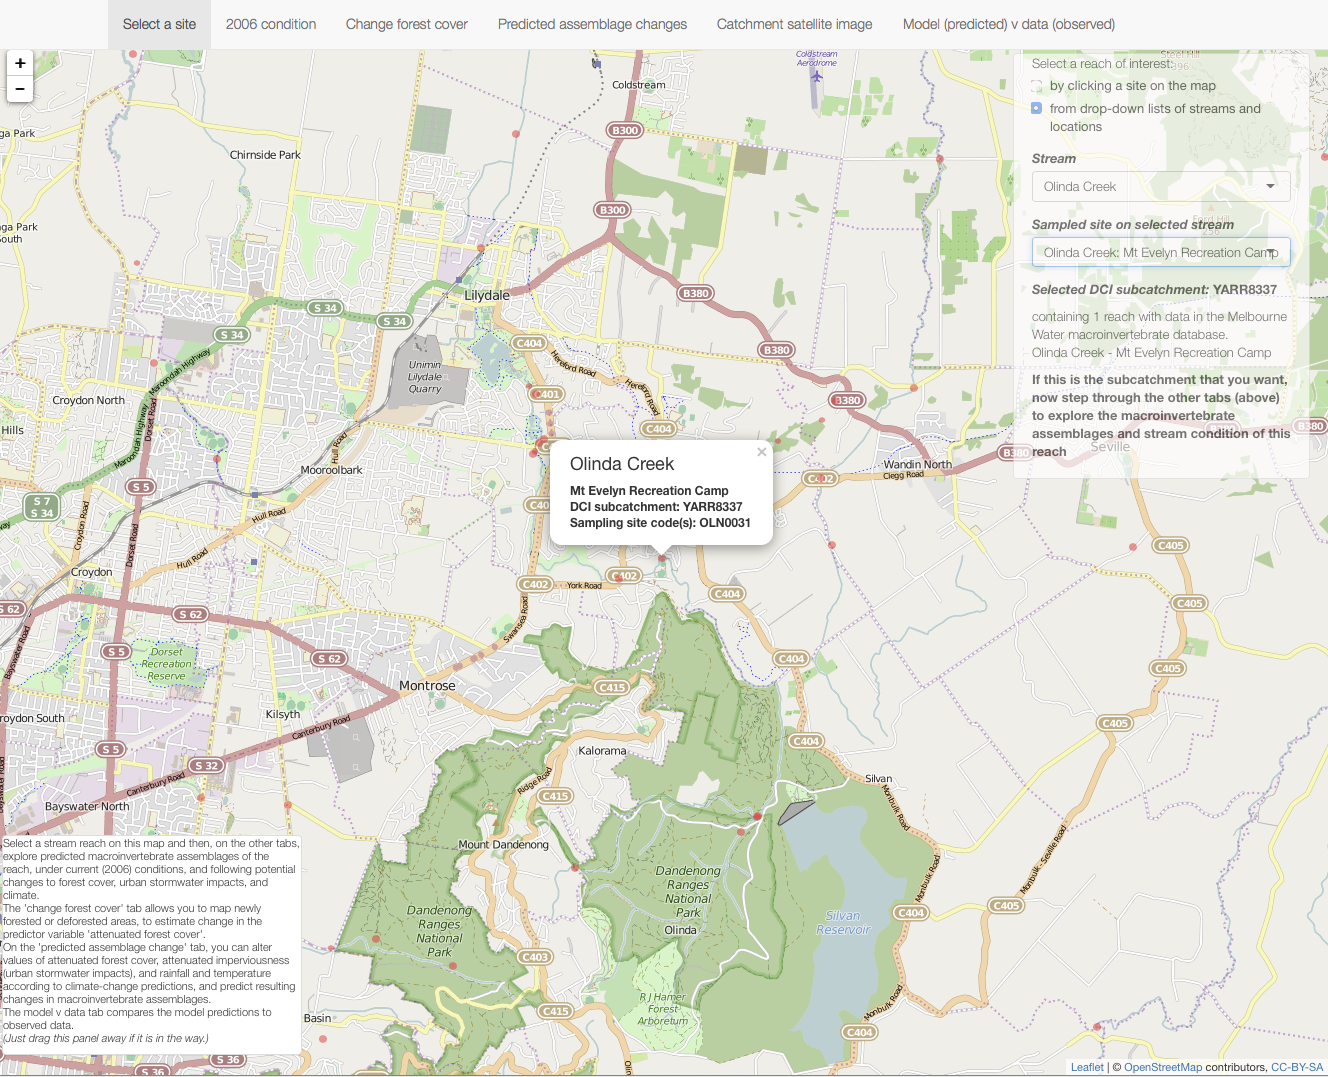
First select a site either by clicking directly on red dots on the map, or selecting a reach by stream name and location description. Here a site on Olinda Creek has been selected using the second method.
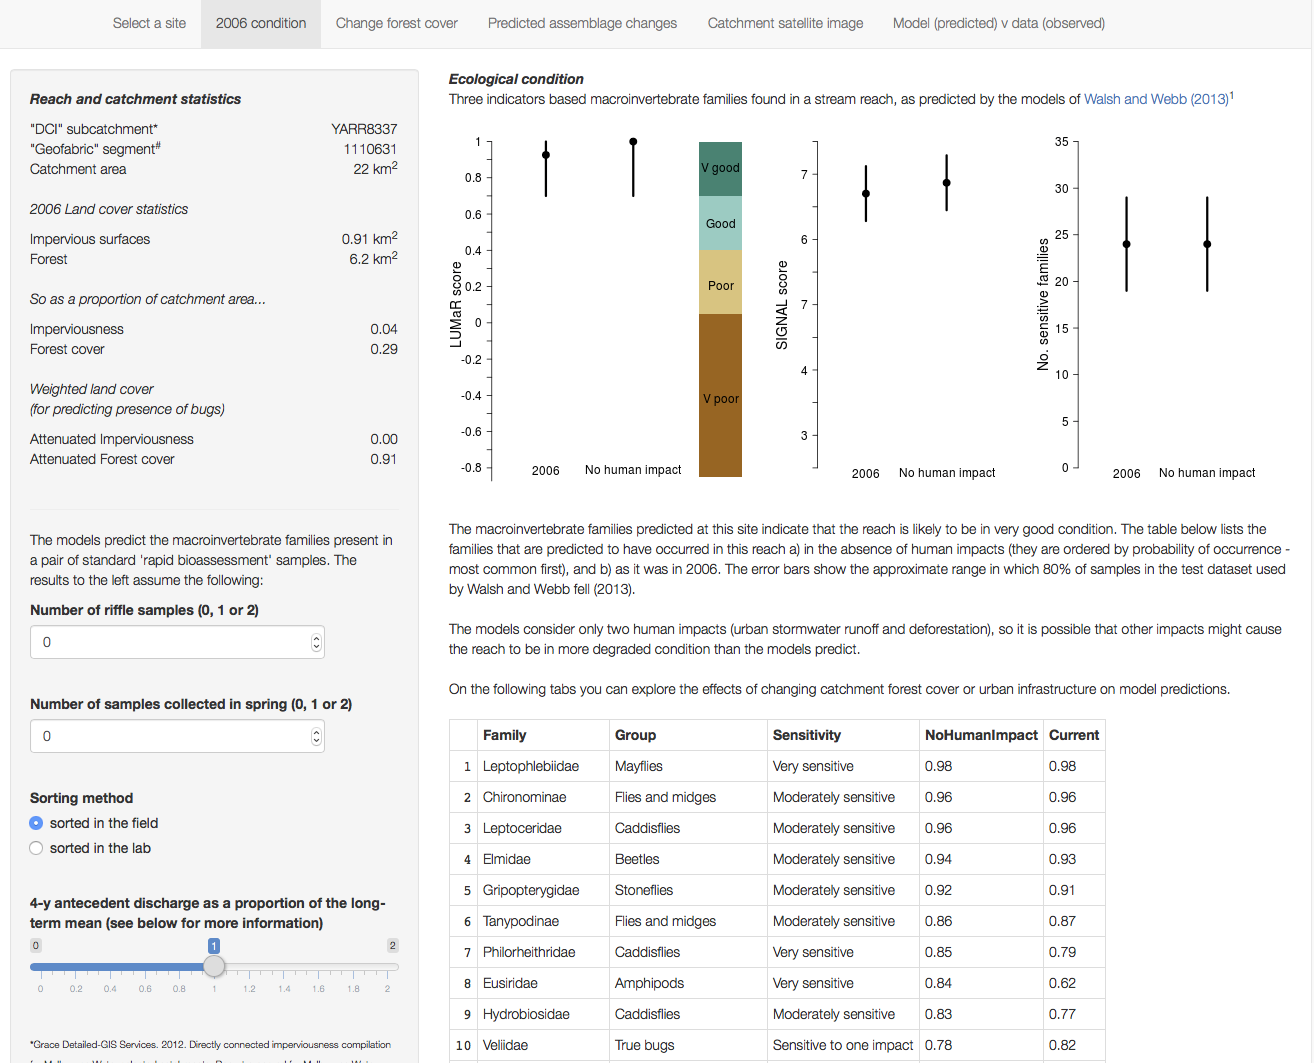
On the second tab, the relevant catchment statistics are listed, and the families predicted to occur in this reach under current (actually 2006) conditions and in the absence of human impacts are reported, together with 3 summary metrics based on the families. You can also explore how predictions change with different sample types and under different antecedent discharge condition.
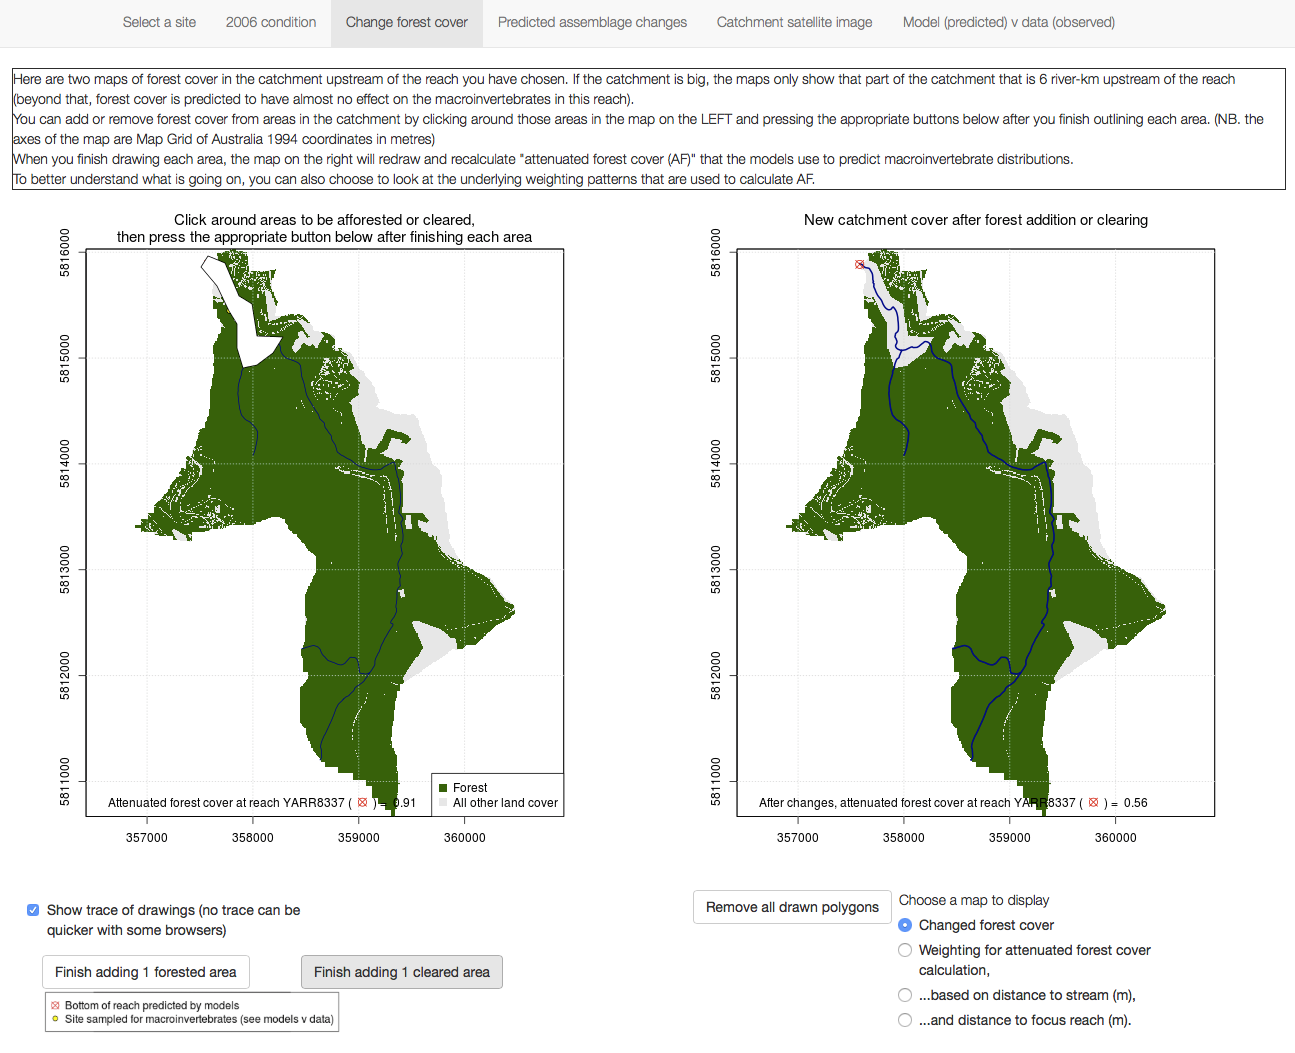
One of the important predictor variables in the models is attenuated forest cover. The next tab allows you to manipulate forest cover in the catchment upstream of the reach (by drawing polygons on a catchment map) to see how the loss or gain of forest cover will change attenuated forest cover.
On the next page, you can see what the effect of changes in attenuated forest cover, attenuated imperviousness (a measure of urban stormwater impacts), and changes in climate have on the predictions. 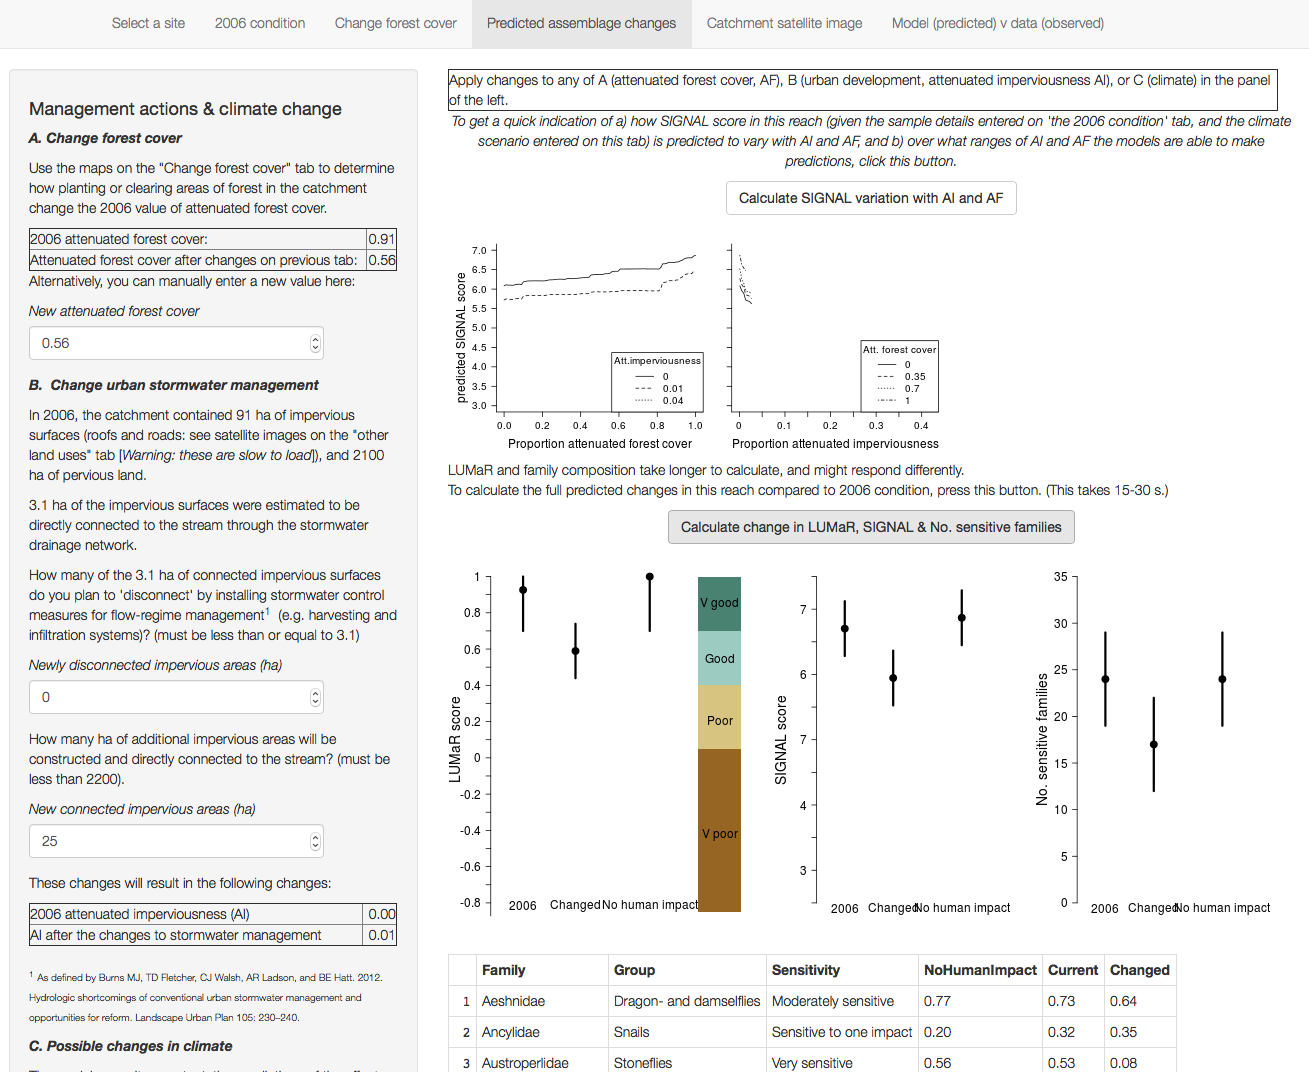
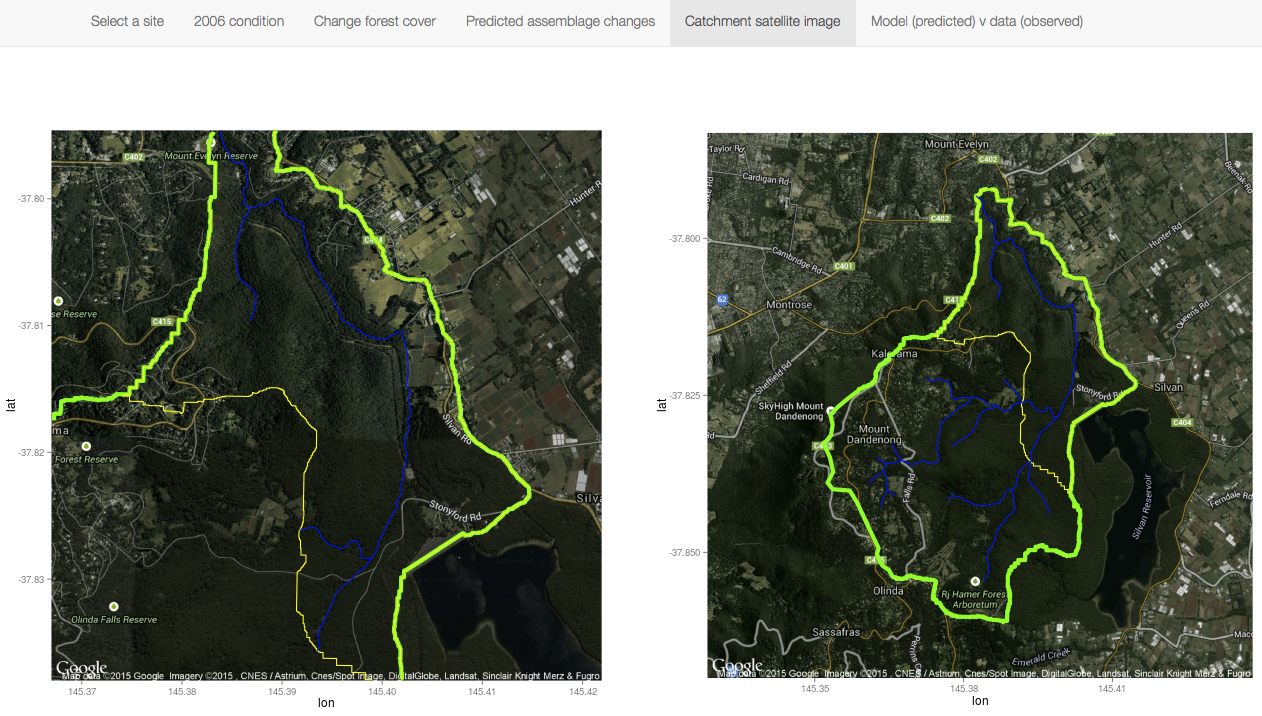
The next tab shows two satellite images of the catchment: one of that part of the catchment 6 river-km upstream of the site (beyond which changes in forest cover are unlikely to have an effect), and a second of the entire catchment. This allows you to look at other land uses other than forest cover that was illustrated in the earlier maps.
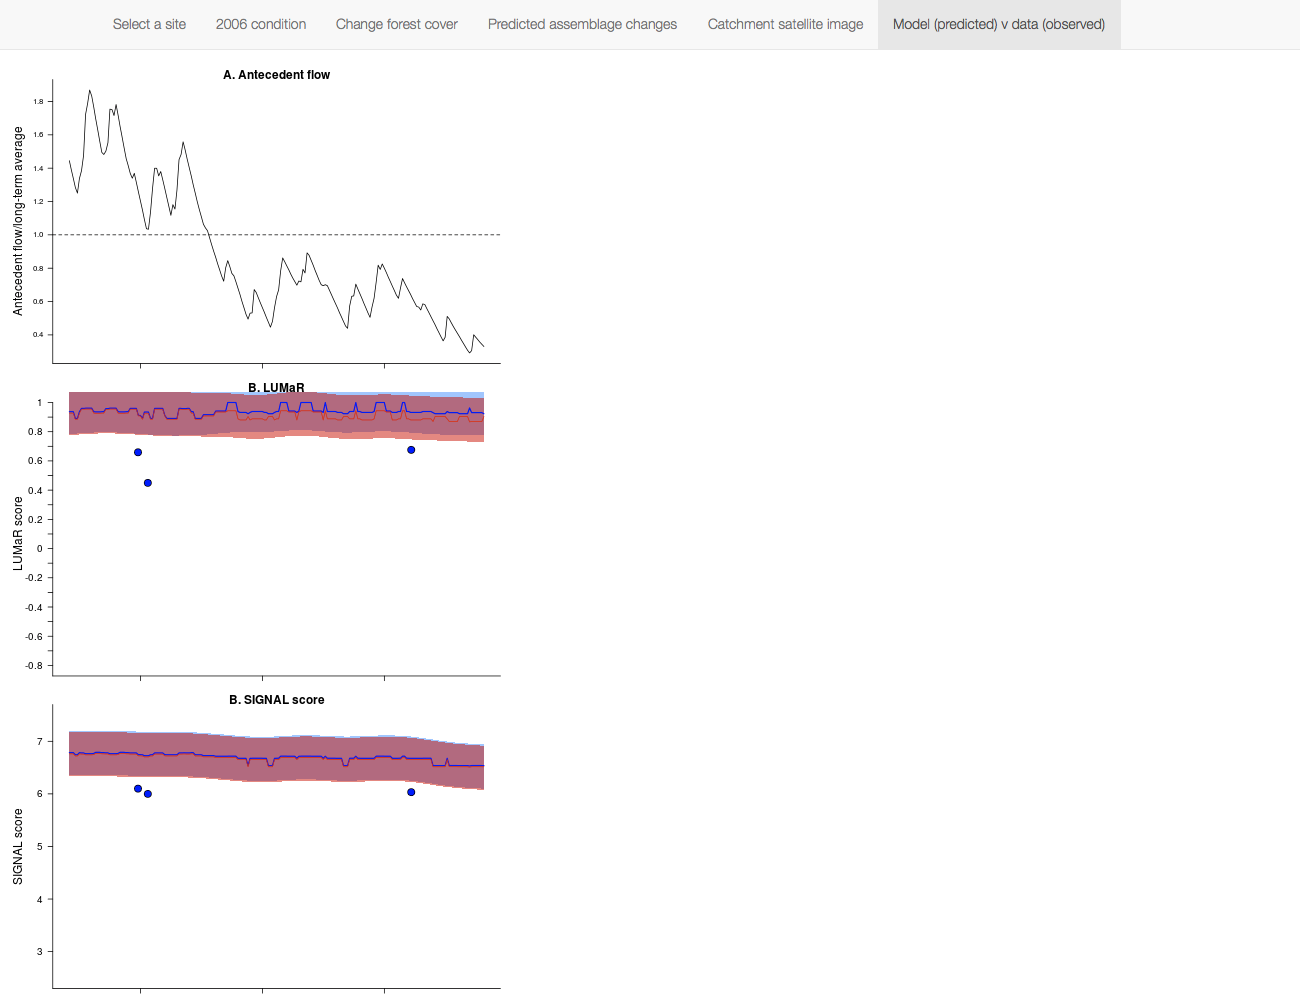
The final tab shows predicted trends in the macroinvertebrate metrics shown in other tabs over the period of study (an increasingly dry time during the Millennium drought), and how the predictions compare with observed data over that time. (In this example, the predictions overestimated the indices, but such an outcome is not common across the dataset. Such overestimates could be the result of errors in the models, or they could be an indication that this reach is impacted by factors other than urban stormwater runoff and deforestation. These are the only human impact variables used in the models. It is possible that reduced biodiversity in this site could be the result of horticulture on the eastern slopes of the catchment upstream of this reach.)
 Anyway, have a play (here’s that link again), and let me know if you have any questions or suggestions for improvements: